
Introduction
It's on the news. It comes up in casual
conversation. It's sitting right there on every retirement account statement
that lands in the mail. And somehow, a genuinely simple explanation of what the
stock market actually is stays surprisingly hard to find. Most explanations
either flatten it into some vague metaphor or jump straight into jargon that
assumes you already know the basics.
There's a very practical reason to
actually understand this. Anyone with a retirement account, an index fund, or
even a single share of stock already has a personal stake in how this system
works, whether they ever sat down and chose to learn it or not.
It’s not the vague one; it’s not the
jargon-heavy one, either. It explains what the stock market is, how pricing is
done, bull and bear markets, and what all those beloved indexes such as the
S&P 500, the Dow, and the Nasdaq measure. This piece is part of our guide
to investing for beginners, and follows up on the basics from our guide on what
it really means to invest and how to purchase your first stock.
What is the Stock Market, Actually?
Strip away the mystique and it's just a
marketplace. Shares of publicly traded companies get bought and sold there,
same basic concept as any other marketplace, just trading ownership stakes
instead of physical goods. There are two places in the U.S. where this really
takes place, namely the New York Stock Exchange and the Nasdaq, which are now
electronic in nature and do not involve the old trading floor of people
screaming anymore, as we see in films.
If you hear somebody say, “The market
was up today,” then he is referring to a composite index, that is, an index
comprising the performance of various companies put together, rather than a
particular one. As far as the U.S. is concerned, there are close to 5,500
companies listed on various exchanges in the U.S. as of 2026.
Think of an exchange as infrastructure,
not a place where value gets created directly. It doesn't decide what a company
is worth. That’s all it does, giving us the regulations, the technology, and
the matching process that will enable buyers and sellers to find each other. No
matter whether the trade takes place on the NYSE, the Nasdaq, or increasingly
through electronic platforms sending out their order to several exchanges at
once, the basic task remains the same: putting together someone looking to
purchase a particular stock and someone looking to sell it at a mutually
agreeable price.
How Stock Prices Actually Change
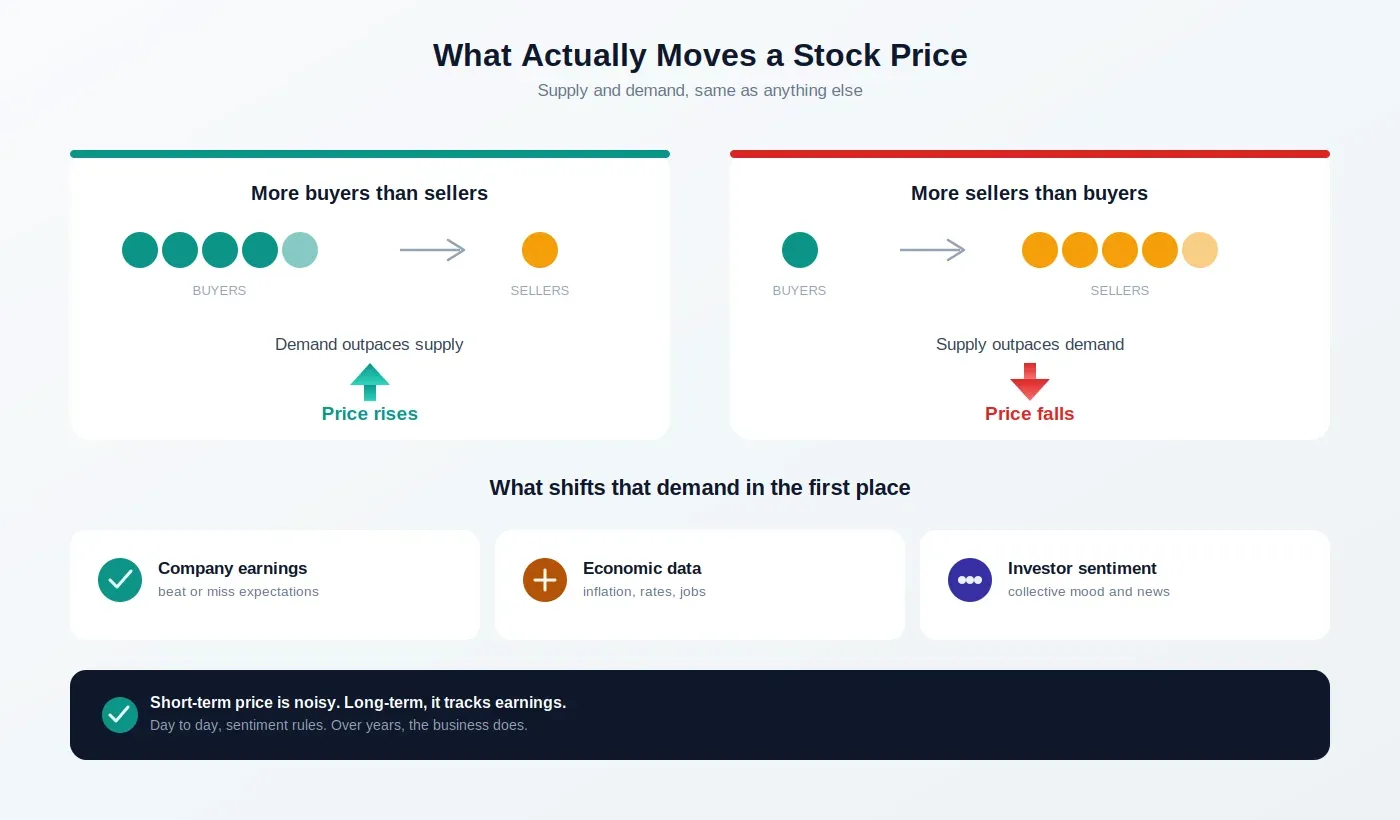
Supply and demand, the same basic
principle behind pricing almost anything. More people wanting to buy than sell,
and the price climbs. More people wanting out than in, and it drops. The harder
question isn't that rule, it's what actually shifts that demand in the first
place.
●
Company
earnings beating or missing expectations. Beat, and demand often rises with the
price following. Miss, and the reverse tends to happen.
●
Broader
economic data, inflation, interest rates, employment numbers, shaping how
investors feel about the economy overall, which moves demand across many stocks
at once.
●
Company-specific
news. Product launch, new leadership team, legal issue, major strategic
alliance, any event that alters the expectations surrounding the direction of a
particular company.
●
Plain
investor sentiment. Sometimes prices move on collective mood more than any
concrete news, markets are partly just a reflection of what millions of people
currently believe.
●
Interest
rate expectations. Changes, or expected changes, shift how attractive stocks
look next to bonds and savings accounts, which can move demand across the
entire market at once.
Worth separating short-term movement
from long-term value here. Day to day, prices swing on sentiment, rumor, and
general mood with barely any connection to a company's actual performance. Prices
have tended, however, to follow real earnings and growth over years and decades
to a far greater extent, accounting for much of why holding on is so effective
at smoothing out all the short-term noise. Consider this analogy: Think of the
price of a stock as a dog on a very long leash, walking alongside its master,
the real earnings and growth of the business.
On any given day, that dog might dart
ahead or lag behind, sometimes by a lot, that's the short-term noise, sentiment
and headlines pulling it around. But over the course of a long walk, dog and
owner end up roughly in the same place. Price eventually catches up to value. This
particular metaphor is attributed to the investment guru, Peter Lynch, and it
does an excellent job of highlighting the importance of how not so much as
compared to how it feels in the moment.
Bull Markets vs. Bear Markets
These terms are often seen in financial
and business reports. Although there’s a mention of an animal, it’s quite easy
to understand their meaning.
●
Bull
market: a long-term
rise in prices, where the economy performs well, unemployment is low, and
everything is rosy. Bear markets tend to last longer than bull markets,
traditionally speaking.
●
Bear
market: 20% fall or
more from the recent high point, usually characterized by economic
uncertainties, high unemployment, or a lack of confidence in general.
Bear
markets are actually a very common phenomenon of investing and not some kind of
rare occurrence that you have to fear. There have been many bear markets
throughout the past century, and all of them have gone back to making new highs
in the end. The average bear market has historically run considerably shorter
than the bull market that follows it, though exactly when any recovery starts
is never something you can call in advance.
Why the animal names specifically? The
most common explanation traces back to how each animal attacks, a bull thrusts
its horns upward, a bear swipes its paws downward, a simple visual for the
direction of the market either way.
There's also a lesser-known middle
category worth knowing: a correction. That's a decline of 10% to 20% from a
recent high, smaller and generally shorter than a full bear market. Corrections
happen a lot more often than bear markets, and most resolve within a few
months, closer to routine than a genuine warning sign on their own. The
distinction mostly matters for calibrating expectations, a 12% drop is a
correction, uncomfortable but common, while a 25% drop crosses into bear market
territory and usually points to something more serious underneath.
It's also worth knowing that neither
type of market moves in a straight line. Even inside a strong bull market,
temporary pullbacks of 5% to 10% happen regularly without meaning the uptrend
has ended. Bear markets, similarly, often include sharp temporary rallies
before continuing their overall decline, sometimes called "bear market
rallies." Trying to precisely call the exact top or bottom of either has
proven extremely difficult even for professional investors, which is a big
reason consistent, long-term investing tends to beat attempts at perfect
timing.
What Market Indexes Actually Measure
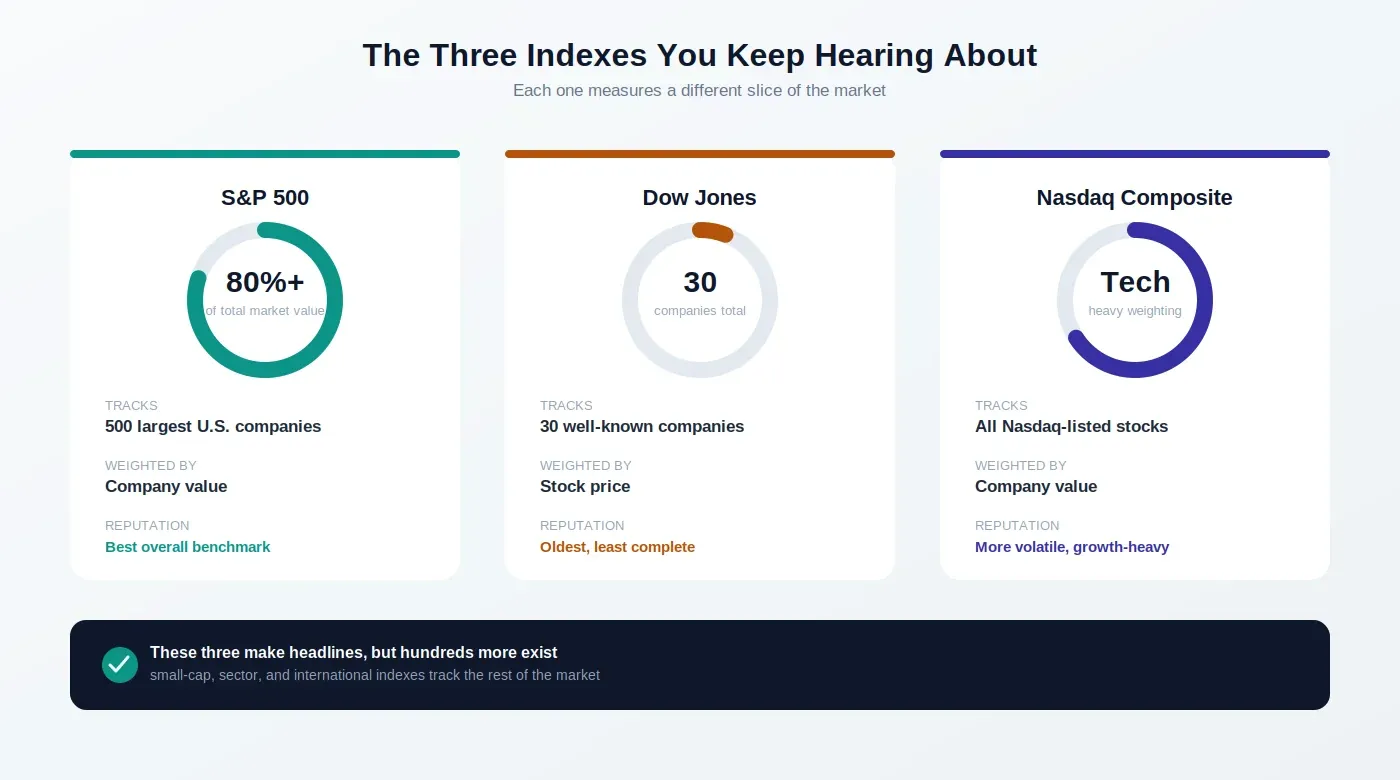
An index tracks a specific group of
stocks to represent how a segment of the market is doing, without anyone having
to check every individual company's price by hand. There are certain names that
dominate the financial headlines.
●
The
S&P 500 Index: indexes 500 of the biggest American corporations,
comprising over 80% of the total market capitalization of American stocks.
Widely regarded as the single best indicator of "the market" in its
entirety.
●
The
Dow Jones Industrial Average: Indexes
only 30 well-known companies depending on their stock prices as compared to
market capitalizations of the companies, and it’s less comprehensive compared
to the S&P 500, though it is the oldest and most known index around.
●
The
Nasdaq Composite: Indexes
all companies listed on the Nasdaq Exchange which is very technology oriented
and thus more volatile compared to the S&P 500.
Why do they matter? Because many popular
index funds and ETFs are designed to mirror any of the above-mentioned indices.
Buying a fund like VOO effectively buys a small slice of all 500 S&P
companies at once, which is exactly why index investing stays so closely tied
to these particular benchmarks.
However, there are many more indexes
apart from these top three, which track different stocks including small
capitalization stocks, sectors such as technology or health care, and even
international and developing markets. One example is the Russell 2000, which
tracks smaller stocks in the US market, and tends to move much more than the
S&P 500. Knowing that these three widely reported indexes represent only a
slice of the total investable market helps put daily headlines in better
context, "the market" moving doesn't mean literally every corner of
it moved the same way.
Who Actually Sets Stock Prices?
Nobody, really, not in the sense of a
single person or institution. It's determined continuously by the combined
actions of every buyer and seller placing orders in that moment, a process
called price discovery. The NYSE and Nasdaq exchanges offer the infrastructure
and guidelines which enable such a match-up, but the price that results does
not come from a decision by any centralized entity regarding the value of the
stock, but rather from the market participants themselves. This explains in
part the tendency of prices to react to seemingly minor bits of news because
the price reflects millions of decisions being made almost simultaneously. A
stock exchange is really best understood as a highly efficient, continuously
updating auction, running through every trading day.
Modern trading also involves a lot of
automated, algorithmic activity, computer programs executing trades on
predefined rules, often within fractions of a second. That doesn't change the
underlying principle at all, prices still reflect the collective actions of
market participants, it just means a meaningful share of those participants
today are automated systems rather than people manually placing each order. For
a long-term, buy-and-hold investor, this distinction barely matters in
practice, the price you see and the price you pay reflect the same underlying
supply and demand either way.
Common Misunderstandings About the Stock Market
●
"The
stock market" and "the economy" aren't the same thing. The
market reflects investor expectations about future profits, which can drift
away from current economic conditions for a while.
●
A
falling market doesn't mean every stock is falling. Broad index movements are
averages, individual companies can move opposite the overall market on any
given day.
●
Short-term
volatility is normal, not a sign something's broken. Daily and monthly swings
are just how markets function, not evidence of a flaw in the system.
●
A
record high doesn't automatically mean stocks are overpriced. Markets set new
highs regularly over long periods simply because earnings tend to grow over
time, a new high is an expected outcome of that growth, not inherently a
warning.
●
You
don't need to understand every mechanism to invest successfully. A diversified,
long-term investor doesn't need to predict short-term moves, understanding the
basics here is generally plenty.
● A high stock price doesn't mean a company is more valuable. Share price alone is meaningless without knowing total shares outstanding, a $50 stock with 1 billion shares is worth far more than a $500 stock with 10 million shares.
To learn more about what investing really entails and how you can begin, refer to our article on what investing really means.
Key Takeaways
●
The
stock market is a market for buying and selling the shares of companies listed
on public exchanges as a result of constant supply and demand.
●
The
prices fluctuate in accordance with performance, economic figures, company
news, and market sentiment, with fluctuations typically more volatile in the
short term than the long term.
●
It
has been found that the bull market generally lasts longer than the bear
market, with every bear market recovering eventually.
●
The
S&P 500 index is the most commonly followed stock market index, with nearly
500 largest U.S. companies and over 80 percent of U.S. market value tracked.
●
No
single entity sets stock prices. They emerge continuously from the combined
actions of every market participant.
Conclusion
From the outside, the stock market can
sound intimidating, jargon everywhere, constant headlines about swings up and
down. But the underlying mechanism really is simple: a marketplace where prices
move based on what buyers and sellers collectively believe a company is worth
right now. Understanding that doesn't require predicting where prices go next.
It just requires knowing enough to stay calm through the normal ups and downs
while a long-term, diversified investment does its actual work.
For the full picture on getting started
with investing, read our complete investing for beginners guide.